Debugging PHP on Windows with NetBeans
It seems that whenever I set up a new computer to debug PHP, I need to Google around to remind myself of the steps, so I thought I would document them here for reference. The following is for an XAMPP Apache/PHP install, but the basic steps are the same for any PHP install.
Install and Configure Xdebug for PHP
The first thing you need to do is get the Xdebug extension for PHP installed and configured. Luckily, XAMPP ships with Xdebug and has the configuration already in php.ini, so you just need to make some minor changes and restart Apache.
- If you are also using XAMPP, skip this step. If you are using an install of PHP without the Xdebug extension, go to the Xdebug Find Binary page, paste in the output of phpinfo() or php -i and they will provide a link to the extension and custom installation instructions.
- Open php.ini in your favourite editor. For XAMPP, it is likely in C:\xampp\php.
- Find and uncomment the extension.
zend_extension = "C:\xampp\php\ext\php_xdebug.dll"</code>
- Find the [XDebug] section and uncomment and/or edit the following values. Many of these are defaults, but I am listing them just in case you have different values.
xdebug.profiler_enable = 1
xdebug.profiler_enable_trigger = 1
xdebug.remote_enable = 1
xdebug.remote_host = "localhost"
xdebug.remote_handler = "dbgp"
xdebug.remote_mode = "req"
xdebug.remote_port = 9000
xdebug.trace_output_dir = "C:\xampp\tmp"</code>
- Restart Apache with the XAMPP control panel.
- Bring up http://localhost/xampp/ and view phpinfo(). You should see Xdebug mentioned twice, once under the Zend engine and then as a PHP module.

 </li>
</li>
- You are done and ready to debug. </ol>
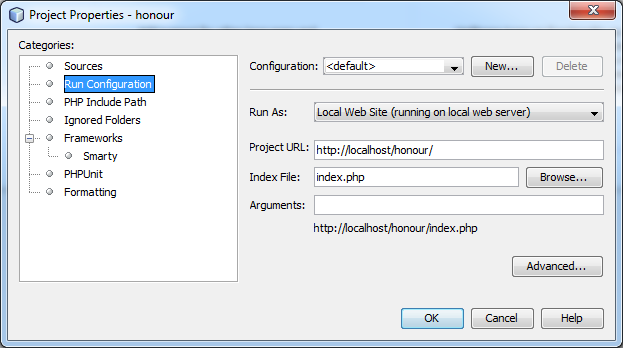
- Start the IDE and load your PHP project. In the Project window, right click on your project and select Properties. Go to the Run Configuration node. You should be running as a Local Web Site. The Project URL should point to the root of your project directory and the Index File should be the file you want to launch into.

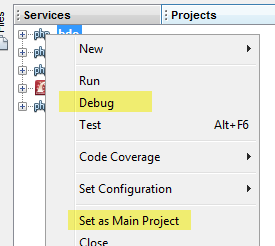
- Right click again on your project. You can select Debug from here and get going right away, but if you first select Set as Main Project, you can just launch into the debugger with the Debug Main Project button on the toolbar or Ctrl+F5. (If Debug is not enabled, you probably need to enable the PHP plugin in NetBeans. Go to Tools | Plugins, click the Installed tab and make sure PHP is enabled.

- When you start debugging, NetBeans will launch the browser to your start page. Notice how it appended the variable XDEBUG_SESSION_START=netbeans-xdebug to the end of the URL to start Apache debugging. If you see any Windows Firewall prompts at this point, accept them.
- As the page loads, NetBeans will break on the first line of PHP code. The line will be highlighted and there will be a little green arrow in the margin to indicate the current line of execution.
 </li>
</li>
- Congratulations, you are debugging. From here, you can set breakpoints by right clicking on the margin of your code and selecting Breakpoint | Toggle Line Breakpoint. You can step through code (F8) using the debug toolbar (if you don't see it, right click on the toolbars and enable it.) You can inspect or even change variables and view the call stack.

- If you are new to debugging code, read more about what you can do in the article on the NetBeans site,Debugging PHP Source Code in the NetBeans IDE. </ol>
Debug with NetBeans
What is not to love about NetBeans? You can use it for Java, PHP, Ruby, Html and C/C++. It integrates well with many bug tracking and source control systems. It provides IntelliSense, database management, works great with Smarty templates and allows you to debug your code. If you haven't tried NetBeans yet, I highly recommend it.
If I missed anything or you have any other suggestions, I would love to hear about it in the comments.